Flexible LED display panels are changing how brands connect with their audiences. They blend technology, creativity, and adaptability in fresh ways. These panels, often called flexible digital displays, support lively visual stories. They go beyond the limits of usual flat screens. Their bendable build lets them fit onto different surfaces. This creates engaging spaces that boost brand impact and viewer involvement.
The Evolution from Traditional Screens to Flexible Displays
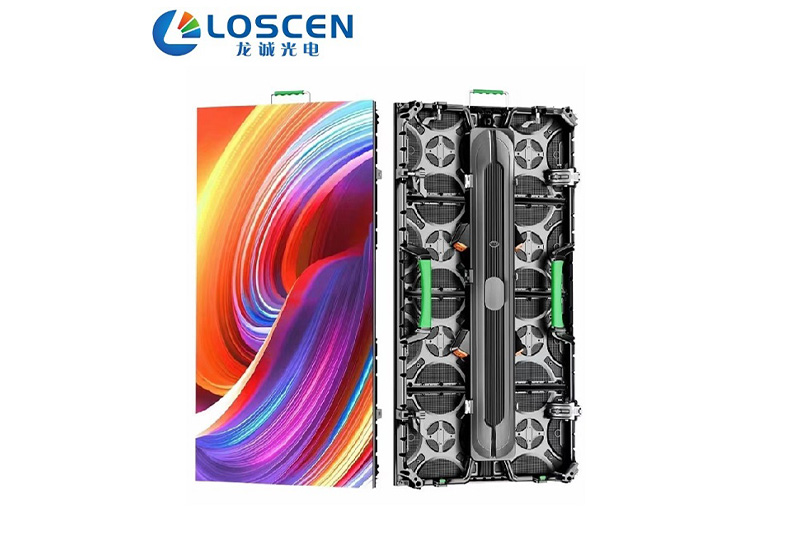
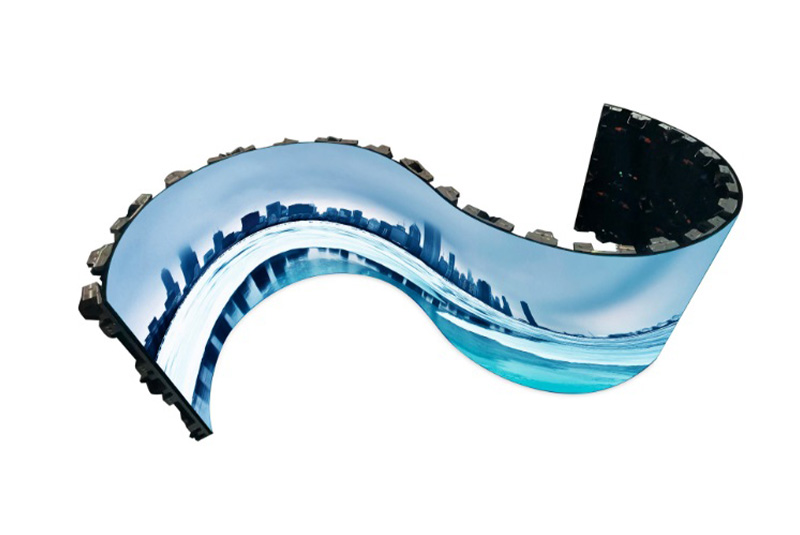
The shift from stiff LED screens to bendable, light options shows a big step in display tech. Old LED setups had rigid builds and weighty parts. These factors limited creative uses. Today’s flexible screens use smart composite materials and micro-LED tech. This allows bending without losing picture sharpness. Such progress meets the rising need for engaging, curved visual setups in shops, fun spots, and building projects.
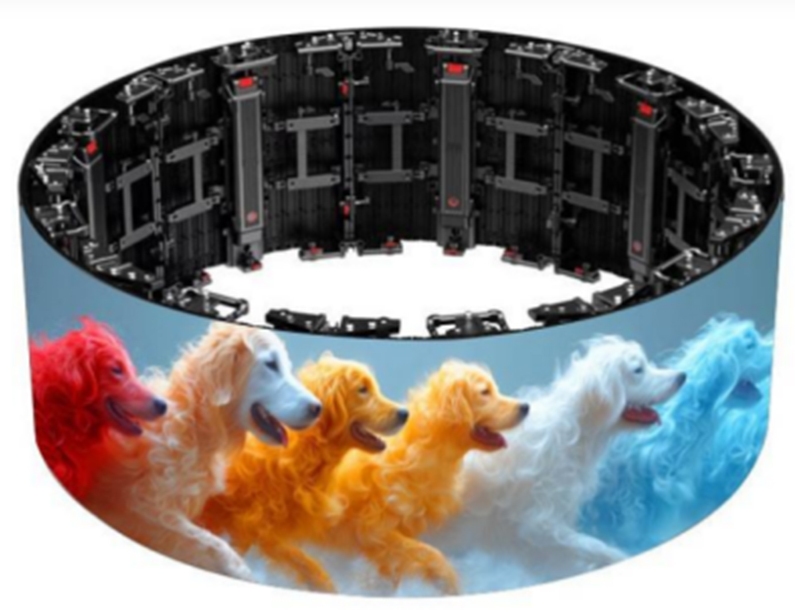
Flexible LED panels now fit on rounded walls, tube-shaped columns, or even wavy areas. They turn still places into moving visual scenes. As experience-based marketing grows, these displays help creators and ad makers build spaces where content seems active. It also responds to the area around it.
The Role of Flexibility in Creative Brand Expression
Flexibility goes beyond a simple tech trait. It acts as a tool for imagination. Bent and wrap-style setups let brands escape the boxy limits of old displays. They surround watchers with action and hues that grab focus. This boosts viewer interest by wrapping them in a brand’s story. It does so instead of showing it on one level.
Plus, flexible digital displays blend well into building parts like posts, roofs, or art setups. Their skill to match various shapes aids in telling tales through active forms and shifts. This turns solid structures into breathing spaces for brand shows.
Why Should Brands Invest in Flexible Digital Displays?
Using flexible LED tech does more than improve looks. It stands as a smart choice for better visibility, savings, and lasting use. Companies that use these tools get ahead with lasting customer moments. These lead to stronger brand recall and faithfulness.
Enhanced Brand Visibility Across Varied Environments
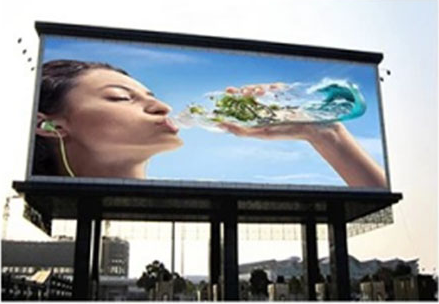
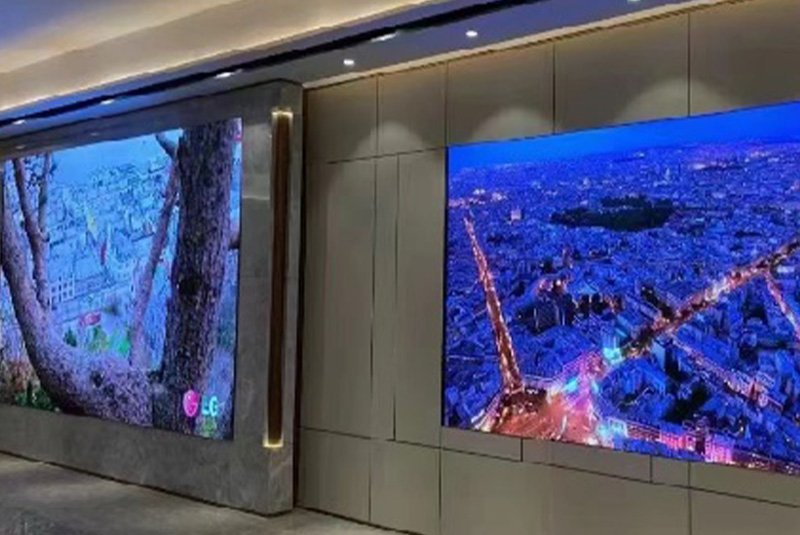
Flexible digital displays work in almost any setting. Think upscale shops, show rooms, travel centers, or open-air gatherings. Their fitting nature allows setup on odd surfaces like bent walls or pillars. There, regular flat panels would not work. This range increases how well messages stick. It does so by offering eye-catching designs that draw eyes, even in busy spots.
For brands in image-filled markets, this fitting quality keeps messages clear and strong. It works no matter the place or light setup.
Cost Efficiency and Longevity as Strategic Benefits
Besides their shape flexibility, these panels bring clear work perks. Their light weight makes setup easier. It cuts down on worker costs and building needs. Power-saving LEDs lower energy use. Yet they keep strong light levels for inside or outside spots.
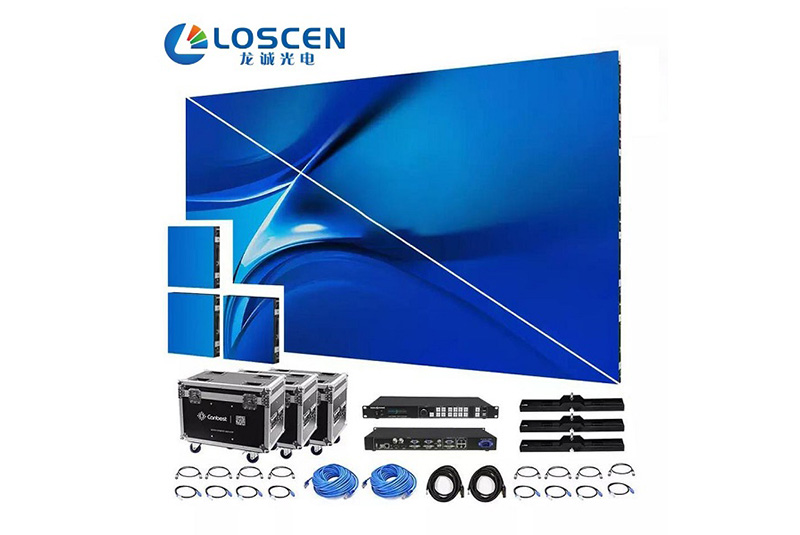
The piece-by-piece build of flexible LED systems also eases upkeep. Single pieces can swap out without taking apart the whole setup. This growth-friendly style aids in saving money over time. It lets brands grow or adjust displays as ad plans change.
How Do Flexible Screens Integrate with Modern Marketing Strategies?
In today’s marketing world, driven by data checks and instant links, flexible screens act as active hubs. They are not just show units. They fit well with all-channel plans that focus on custom touches and quick replies.
Integration with Interactive Technologies
New flexible LED panels handle touch features, movement detectors, and added reality (AR) tools. These turn still ads into hands-on events. At gatherings or shop sales points, buyers can join in with shown content. They might check item facts or take part in game-like deals built around move following or hand signs.
This joining creates stronger feeling ties between brands and viewers. It also pulls in useful action data for plan tweaks.
Data Analytics and Content Adaptation Capabilities
The real strength of flexible digital displays comes from changing content on the spot with live data. By linking with cloud-based content handling systems (CMS), ad folks can refresh images right away across many sites. They base updates on crowd traits or flow patterns.
For instance, a shop brand could shift promo images by time or buyer crowd spotted through sensors. This keeps every message fitting the moment. Such a data-led way turns flexible LED setups into smart talk tools. They can grow with viewer actions.
What Technical Features Make Flexible LED Panels Stand Out?
The smart building of flexible LED panels guarantees top work in tough spots. It keeps great picture quality even when shaped into tricky bends or turns.
Display Performance and Durability Factors
Fine pixel spacing gives sharp images from any watch angle. It holds clearness over uneven areas. Smart materials in panel making fight heat rise, water contact, and force strain. These traits matter for setups facing changing weather.
Strong wire plans with good power control add to long life stats. These often beat those of usual flat LEDs. This toughness ensures even light spread over years of steady run. It avoids fade in color truth.
Installation Versatility and Control Systems
Setup range is a key plus of new flexible LED systems. Magnet pieces make fixing on uneven spots simple. They keep exact line-up between parts for smooth sight flow. Fit with various control rules allows matched play across big nets or multi-screen plans.
Far-off watch tools add to trust by letting quick fixes via main boards. These track heat changes, power steadiness, or pixel issues. They cut stop time with ahead upkeep steps.
How Does Shenzhen Longcheng Photoelectric Technology Co., Ltd Enhance the Market for Flexible Digital Displays?
Shenzhen Longcheng Photoelectric Technology Co., Ltd shines as a reliable maker focused on pro-level flexible digital display answers. These suit world fields like shops, fun areas, building works, and travel nets. The firm’s pledge to exact building ensures steady product trust. It comes with full tech help plans aimed at long client joy.
Core Competencies of Shenzhen Longcheng Photoelectric Technology Co., Ltd
Their main skills cover know-how in making top flexible LED modules. These adjust to many weather types. From inside shows needing close pixel work to outside fronts wanting weather-proof strength. Steady research and development spending pushes gains in panel bend and picture truth. It also tunes making steps for green ways.
On top, Shenzhen Longcheng Photoelectric Technology Co., Ltd stresses top after-sale care. This includes pro setup tips, system tune help, and ongoing fix programs. They guard run steadiness through each item’s life span.
What Future Trends Are Shaping the Next Generation of Flexible Screens?
As display tech moves toward deeper ties with smart setups, the coming wave of flexible screens will mix art style with digital smarts. This will reshape how sight talk links with daily spots around the globe.
Innovations Driving the Next Phase of Development
New ideas include see-through flexible LEDs for two-way sight uses. These fit well for glass walls or shop fronts. There, watchers can view content from both sides at once. Linking with Internet of Things (IoT) setups will let auto content shifts based on setting clues. Examples are light levels or user nearness info.
At the same time, makers are using earth-kind materials in all making steps. This cuts harm to nature while boosting reuse. It matches tech steps with world green aims key to today’s firm duty plans.
Conclusion: Transforming Brand Experiences Through Flexibility
Flexible LED display panels mark a big change from still signs to active tale media. These can remake space views. By adding these handy techs into ad bases, especially via ties with solid suppliers like Shenzhen Longcheng Photoelectric Technology Co., Ltd, groups can lift brand spots. They go from flat shows to deep events marked by savings, lasting time, hands-on links, and free imagination.
FAQs
1. What distinguishes flexible LED display panels from traditional flat screens?
Flexible panels can bend or curve without affecting image quality. They allow installation on irregular surfaces where standard flat screens cannot fit.
2. Are flexible digital displays suitable for outdoor use?
Yes, many models are designed with weather-resistant coatings and high brightness levels suitable for outdoor advertising or architectural integration.
3. How can businesses ensure long-term performance of flexible screens?
Partnering with reputable manufacturers like Shenzhen Longcong Photoelectric Technology Co., Ltd ensures access to durable components, professional installation guidance, and consistent technical support throughout the product lifecycle.