Nullam dignissim, ante scelerisque the is euismod fermentum odio sem semper the is erat, a feugiat leo urna eget eros. Duis Aenean a imperdiet risus.
Loading
Nullam dignissim, ante scelerisque the is euismod fermentum odio sem semper the is erat, a feugiat leo urna eget eros. Duis Aenean a imperdiet risus.
The fine-pitch indoor LED sector holds steady ground in 2026. Market analyses place overall fine-pitch indoor display value around USD 2.28 billion this year, with P2.1–P2.5 pitches continuing to command a substantial portion of mid-range video wall deployments across commercial, corporate, and institutional projects. Pricing for indoor units generally sits between $650 and $1,300 per square meter, influenced by ongoing refinements in supply chains, driver IC efficiency gains, and broader adoption of energy-conscious components.
Quotations still vary widely—sometimes dipping toward $500 per square meter on basic builds, stretching past $1,500 on premium specs. Too many decisions overlook downstream realities: structural accessories, certified installation labor, cumulative electricity draw across five years, spare parts inventory, and periodic calibration or module swaps. Mismatched choices frequently lead to visible moiré patterns under camera, accelerated color drift, or unexpected lamp failures that erode projected returns.
This overview moves past isolated price sheets. It lays out methods to derive accurate landed costs for 2026 deployments, pinpoints configuration decisions that matter most, and demonstrates TCO frameworks that separate worthwhile investments from short-term bargains. Core coverage includes P2.5 LED screen price 2026, P2.5 indoor LED cost per sqm, P2.5 buying guide, indoor fine-pitch LED TCO, and related decision points.
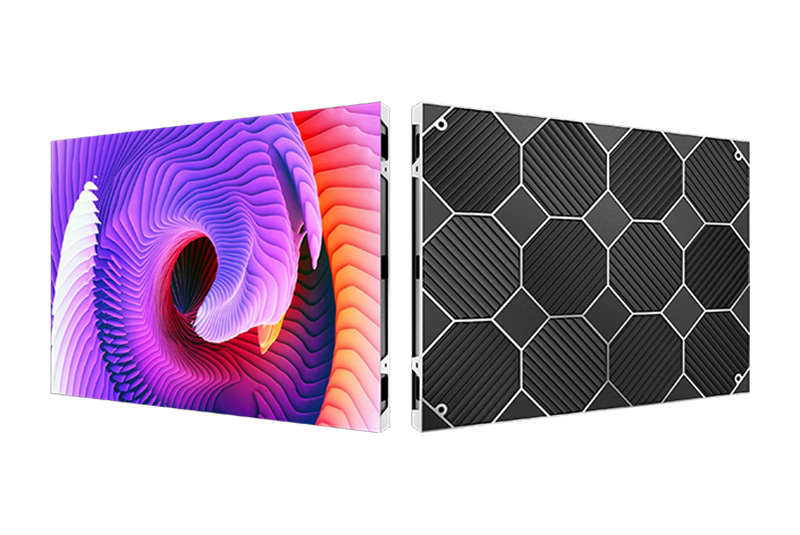
Fine-pitch indoor applications have consolidated around practical viewing distances. P2.5 delivers crisp performance from roughly 2 to 5 meters—precisely where most conference suites, retail showrooms, hotel reception areas, and worship spaces position audiences. Finer pitches below P2.0 command premiums that rarely justify incremental gains in standard corporate or hospitality settings, while P3 and coarser options start showing pixel structure at closer ranges.
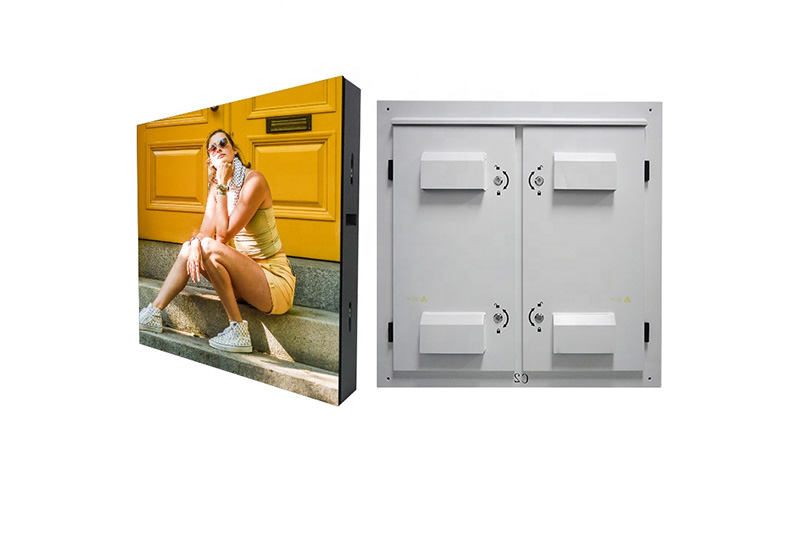
Supply-chain stabilization has moderated raw material swings, though upward pressure persists from higher-refresh driver demands and low-power IC adoption. Outdoor P2.5 remains niche; brightness thresholds and IP-rated enclosures push costs considerably higher than indoor equivalents.
SMD packages hold the majority share, supplemented by growing use of protective surface treatments and flip-chip architectures that cut dead-pixel incidence and slow luminance decay. Procurement teams increasingly evaluate five-year horizons rather than initial capital outlay alone. Power and service typically dominate 55–65% of lifetime expense on fixed installations running extended hours.
Field experience reinforces the logic: one mid-tier conference facility swapped legacy P3 arrays for modern P2.5 panels. Resulting gains included sharper edge definition on presentation content, reduced ambient-light washout, and measured 18–22% drop in annual energy draw from updated driver efficiency. Transitions of this nature explain sustained preference for P2.5 in balanced-performance scenarios.
Indoor P2.5 quotations cluster into recognizable tiers based on component pedigree and build quality.
Entry-level configurations—standard SMD lamps paired with steel cabinets—range $600–$850 per square meter. Mid-tier builds featuring established lamp suppliers, die-cast aluminum framing, and 3840 Hz refresh fall $850–$1,100 per square meter. Top-spec variants—7680 Hz capability, advanced protective layers, high-efficiency drivers, and five-year coverage—push $1,100–$1,400+ per square meter.
Individual 320×160 mm modules generally trade $25–$45 depending on lamp binning consistency and encapsulation level.
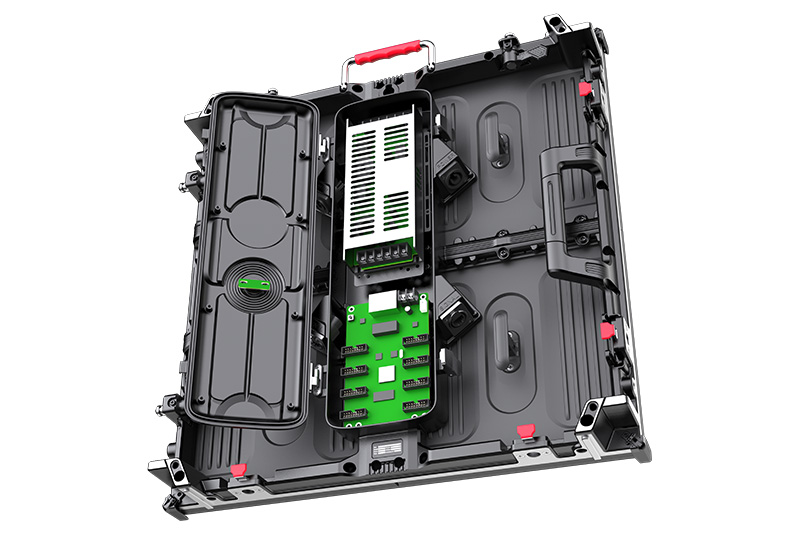
Key cost drivers include lamp brand longevity and uniformity, refresh thresholds that eliminate flicker in broadcast or smartphone-captured footage, cabinet construction affecting weight and seam precision, indoor-optimized brightness (600–1,000 nits to balance visibility and consumption), and control topology (synchronous for centralized feed or asynchronous for networked standalone loops).
Five-year TCO modeling exposes differences sharply. Lower upfront tiers often accumulate elevated replacement and technician visits. Mid-range assemblies frequently yield the flattest curve when electricity runs 180–220 W per square meter across typical 10–12 hour daily cycles at commercial rates around $0.14–$0.18 per kWh. Premium builds offset added expense via extended MTBF figures and minimized downtime.
Structured evaluation prevents downstream rework.
Apply the industry benchmark: minimum comfortable distance in meters ≈ pixel pitch × 800–1200. P2.5 therefore suits 2–3 meter minimums effectively, extending comfortably to 5 meters in typical meeting or lobby layouts. Control-room or broadcast-grade needs may dictate sub-P2.0.
Pixel density hits 160,000 per square meter. Derive required area from venue layout and content resolution targets. Native 4K playback demands sufficient physical width—often 8–12 meters—to avoid aggressive scaling artifacts.
Core equation: TCO = acquisition cost + [power density (W/sqm) × daily runtime hours × annual operating days × lifespan years × local kWh rate] + projected maintenance allocation. Example: 100 sqm array at 200 W/sqm, 10 hours daily, 300 days yearly, five years, $0.15/kWh yields roughly $9,000–$13,500 in electricity alone before spares or service.
Target ≥3840 Hz refresh for motion clarity, 16-bit processing depth for gradient smoothness, brightness uniformity exceeding 95% across modules, and front-service access wherever rear clearance proves restrictive.
Move beyond headline pricing. Demand documented field failure statistics, regional service footprint, spare module pricing transparency, and calibration traceability records.
Insist on live demonstrations measuring real-world luminance, Delta E color deviation under venue lighting, thermal stability after multi-hour runs, and mechanical seam alignment under load.
A 50 sqm corporate boardroom installation using mid-range P2.5 typically lands hardware between $45,000 and $55,000. At 200 W/sqm average draw, five-year electricity approximates $3,500–$4,500 assuming standard commercial tariffs. Maintenance remains contained with quality bin consistency. Aggregated ownership cost positions favorably against coarser or finer alternatives.
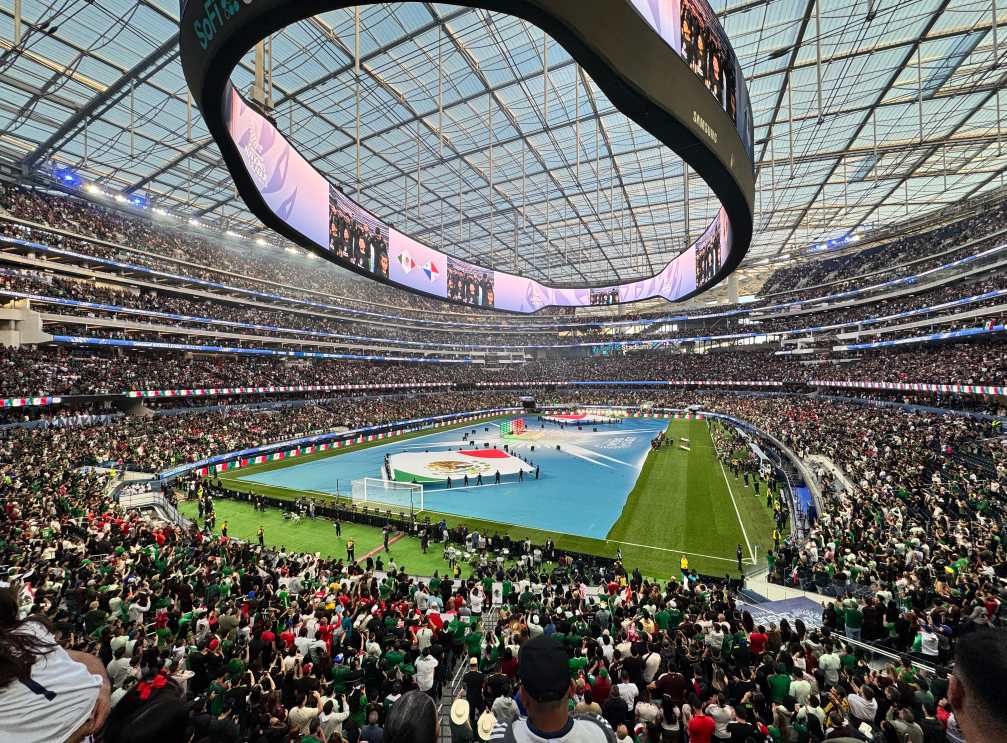
Retail atrium deployments leverage high-refresh P2.5 to heighten promotional impact. Measured increases in dwell time and conversion lift frequently recover capital within 18–30 months through traffic-driven revenue.
Lobby upgrades replacing P3 with P2.5 consistently register stronger brand perception from tighter pixel structure. Concurrent 15–25% power reduction compounds annual savings on extended-operation cycles.
Additional context emerges from broader industry patterns. Recent market data indicates fine-pitch shipments growing modestly year-over-year, with P2.1–P2.5 retaining mainstream traction amid rising emphasis on modular, lightweight designs and integrated energy management. Procurement increasingly incorporates adaptive brightness controls that dynamically scale output to ambient conditions, trimming unnecessary consumption during off-peak periods.
Established in 2013 and headquartered in Bao’an District, Shenzhen, Shenzhen Longcheng Photoelectric Technology Co., Ltd. concentrates on fine-pitch indoor LED solutions tailored for conference environments, auditoriums, education facilities, and similar fixed installations. Manufacturing emphasizes rigorous process control, including 72-hour burn-in validation for stability assurance. The portfolio supports customization across pixel pitches, backed by ROHS, FCC, CE, ISO9001, and additional compliance credentials. Exports reach more than 120 countries and regions, reflecting consistent delivery of durable, high-refresh, energy-aware systems paired with responsive technical partnership.
P2.5 maintains its standing in 2026 as the pragmatic high-definition indoor choice where budgets require meaningful clarity without disproportionate expenditure. Long-term viability rests on comprehensive TCO assessment rather than isolated purchase pricing. Deliberate specification alignment and supplier vetting secure dependable multi-year operation.
Organizations preparing 2026 deployments benefit from applying the outlined calculation methods to internal requirements before engaging specialized manufacturers for current quotations and project-specific engineering.
Indoor P2.5 pricing generally spans $600–$1,400 per square meter in 2026. Entry configurations start near $600–$850, mid-tier builds with reliable components and 3840 Hz refresh range $850–$1,100, and high-spec variants with protective treatments and extended coverage reach $1,100–$1,400+.
Combine initial hardware and installation expense with projected electricity—using power density (typically 180–220 W/sqm) multiplied by daily hours, operating days, years, and local kWh cost—plus realistic maintenance reserves. This approach surfaces true five-year ownership figures beyond headline quotes.
P2.5 aligns optimally with 2–5 meter viewing distances prevalent in conference, retail, and lobby settings. Finer pitches add cost without proportional benefit in standard use cases, while P3 risks visible pixelation at closer ranges.
Refresh rates of 3840 Hz or higher minimize motion artifacts, 16-bit grayscale supports smooth tonal transitions, high uniformity prevents visible patches, and front-access design simplifies wall-mounted service.
Advanced drivers and adaptive controls cut draw by 15–25% versus legacy designs. On extended runtime installations, the difference translates to thousands in electricity savings over five years, shifting overall value decisively toward efficient builds.


Leave a comments